
Keeping on the Sustainability path
Precision agriculture?
Precision agriculture methods are based in state-of-the-art sensing technologies that harvest data from sources of different nature and distance to the field: images can be captured by satellites high above the atmosphere or from unmanned aviation systems [UAS], also known as drones, and combined with sensors spread across the fields to harvest characteristics such as the chemical mixture of the soil, its temperature and humidity, air temperature, water levels and underwater reserves.
The analysis of the outcomes of different production techniques or adjustments to farming practices and schedules across neighbouring plots is reviewed through the combination of Information coming from sensor monitoring is integrated with weather and third party data to show which combination of inputs is best suited to provide the optimal outputs.
This is simultaneously a detailed and holistic approach to production: one tries to find the optimal variables for each elementary plot for farming or forestry to achieve the overall optimum and identify and differentiate constraints and issues that might affect neighbouring plots in different ways. Such information is also useful for algorithms that establish different models and predictive scenarios according to the product species, climate and ground conditions found on each scenario. Understanding the underlying cause-effect consequences will help transfer the knowledge and practices from one area to the next.
On the previous newsletter, it was illustrated how a small forest divided in 14 different areas exhibited different performance under a common forestry practice. If precision agriculture methods had been used in such case along the growth period it is likely the number, height and diameter of the trees could have been nudged towards more optimal results.
The purpose of this form of farming is to provide unambiguous information to support substantiated decision making which, in turn, shall lead to the optimization of the different kinds of resources involved in the production process:
- Natural Resources – Water and moisture, soil, air, genetic properties of the plant;
- External products – Fertilizers, agrochemicals;
- Equipment and energy;
- Human labour
As mentioned, one of the main benefits of precision agriculture over traditional farming is to subdivide a farming unit into smaller sub-units, identifying specific characteristics and needs according to the results obtained from the sensors.
If geo-referenced sensor data generates geo-referenced farming decisions which are then fed into geo-referenced actuators, it is possible to distribute resources “à la carte” while, at the same time, adapting the best farming techniques to each sub-unit, thus managing the farm in a more sustainable way. While precision agriculture may lead to an initial increase in setup and training cost, its medium-to-long term goals is to reduce resource use and improve human and plant health and at the end of the day, the environmental and economic benefits of agriculture or forestry.
Multispectral Remote detection:
Utilizing the operational knowledge acquired in LiDAR data surveys, the Albatroz UAS (Unmanned Aircraft System or drones) Operations team delved into remote image detection using a multispectral camera – Micasense Altum – attached to the quadcopter drone ZD550, produced by NexxUAV.
The following images show the multispectral camera and the quadcopter used:

Figure 1: Altum – Multispectral Camera (and DLS2)

Figure 2: Quadcopter with the Altum attached
The Altum camera is a sensor with the following main characteristics [1]:
Integrates 5 spectral bands: Blue, Green, Red, Red Edge, Near Infrared (NIR) with a Long-Wave Infrared (LWIR) thermal camera with radiometric calibration, capturing all these images simultaneously.

- The wavelength (measured in nm) of each band of the Altum sensors is graphically represented in the following image:
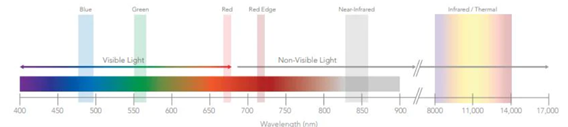
Figure 3: Characterization of the spectral band of each Altum sensor
The camera is connected to a luminosity sensor (DLS 2 – Figure 4) that captures values of intensity and angle of incidence of sunlight, allowing data acquisition with better radiometric precision. As it has an integrated GNSS sensor of the GPS+ type, these data are georeferenced.

Figure 4: Luminosity Sensor – DLS2 – attached to Altum
The added value of this type of multispectral camera lies in its ability to process acquired data to determine, in addition to digital terrain and surface models (DTM/DSM), Vegetation Indices. These indices are calculated by mathematically relating the reflectance values in different bands along with the temperature values provided by the thermal camera. They can provide information about soil condition and crop vigor at different stages, particularly regarding water stress values.
While this information can also be obtained from satellite images, the costs are often prohibitive or more acceptable at the expense of spatial and temporal resolution [2]. Depending on the size of the area to be monitored, it can be interesting to complement satellite images with lower spatial resolution (but with formulas that already account for necessary atmospheric corrections) with information obtained from UAS-coupled sensors (although the atmospheric correction methods used are still under study).
Method and Data Survey in Prunaceae orchard (stone fruit):
As part of the “acquisition of knowledge in the workplace,” from January 2023 to June 2023, the UAS operations team of Albatroz planned four complete surveys in an area of stone fruit trees (mostly cherry trees but also peach trees) covering approximately 40 hectares (acres), at different stages of the production process:
- End of January – Winter – Trees without leaves or fruit;
- March – Early Spring – Flowering trees with emerging leaves;
- Early May – Spring – Trees with fruit and leaves;
- End of June – Early Summer – Trees with foliage after harvest.
Initially, flights were conducted at 100 m Above Ground Level (AGL) and 85 m AGL to compare the advantages of higher altitude flights with greater ground speed and less detail on the ground (lower GSD). However, it was observed during data processing that there were areas with missing images at 100 m AGL, leading to the decision to adopt the 85 m AGL level for subsequent flights.
The flight planning software used in all data surveys was UgCS. The image below shows the flight plan for one of the flights planned with the ZD550 and Altum attached, specifying parameters such as lateral spacing (overlap), ground speed, and desired flight height (AGL).
The following figure shows the operational parameters that were programmed for the flights.

Figure 5: Used Flight Parameters
The method of image capture adopted was “Overlap,” which seemed more suitable and reliable for the type of terrain in question, as it is a virtually flat area with no significant variations in relief. With this method, the camera is triggered whenever it reaches the pre-defined longitudinal overlap value along its path. It is also a quite “economical” method in terms of data storage as it only starts capturing images above a predefined reference height.
Before each takeoff and after each landing of the UAS, a photograph is taken for radiometric calibration during the processing phase of the remaining images. This photograph is taken on a calibrated panel that accompanies the camera from the moment of its acquisition. Each Altum sensor produced is related to its calibrated panel, with the reflectance values (referring to each of the bands) fixed and relative to this panel, programmed into the camera software. The image below shows the calibration panel.

Figure 6: Calibration Panel
Common Examples of Vegetation Indices:
In the literature on precision agriculture and remote sensing using satellite and UAS images, several vegetation indices are mentioned. Some are useful for measuring the percentage of chlorophyll in plant leaves, while others can be used to calculate nitrogen content or indicate vegetation water stress. There are older indices, such as the Normalized Difference Vegetation Index (NDVI), first determined by J.W. Rouse in 1974 [3], and newer ones that fill the gaps left by the older indices.
Some examples and definitions:
- NDVI – Normalized Difference Vegetation Index:

As the level of chlorophyll in the plant increases, the reflectance intensity in the NIR band increases and decreases in the Red band. NDVI values can thus have a maximum of 1, with lower values indicating lower plant vigor. NDVI is also relatively effective in distinguishing between vegetation and soil and is normally recommended for identifying differences in above-ground biomass, over time or space. NDVI is more effective at depicting canopy density variation during early and intermediate stages of development but tends to lose sensitivity at high canopy density levels.
- NDRE – Normalized Difference Red Edge Vegetation Index:
![]()
Similar to NDVI, NDRE is sensitive to chlorophyll content in leaves but also to leaf area variability and soil background effects. High NDRE values represent higher levels of leaf chlorophyll content than lower values. Soil usually has the lowest values, less healthy plants have intermediate values, and healthy plants are identified by higher values.
The NDRE (Figure 7) is a better indicator of vegetation health/vigor than NDVI in the case of more mature vegetation since it generally does not lose sensitivity when plants have already accumulated a critical level of leaf coverage or chlorophyll content [4].

Figure 7: NDRE generated with Altum in one of the areas of interest in the orchard
As mentioned earlier, with multispectral camera images, in addition to vegetation indices, it is also possible to determine digital terrain and surface models (DTM/DSM) as well as generate an orthomosaic (photographic representation of the area of interest; Figure 8 shows an example of an orthomosaic).

Figure 8: Orthomosaic of the area of interest
Continuing the Work:
The next steps should involve studying the information generated by the data acquired during this production cycle, correlating it with data provided by sensors on the ground (soil characteristics, etc.) and with meteorological records (such as those from the ‘Direcção Regional de Agricultura e Pescas’ meteorological stations) to identify patterns and models that lead to the identification of potential optimization needs for specific resources.
Conclusions:
Precision agricultural and agroforestry production make sense and are urgently needed to implement most of the Sustainable Development Goals. Currently, it seems inevitable that, with the level of technology available, both in terms of sensors and the means to deploy them in the field, this way of managing agricultural and agroforestry productions will evolve very rapidly. However, it is a consensus among many interested and knowledgeable individuals in this field (from whom we have received feedback) that there is still a significant gap between the highly technological stage of data acquisition (valid and accurate) and its transformation into clear, direct, understandable, and valid outputs for the farmer/producer, in a way that can be directly applied in the field. The added value in this value chain will undoubtedly lie in the development of this bridge between the two stages.
References:
[1] Micasense, “User Guide for MicaSense Sensors”, Revision 09, Seattle, WA, January 2021
[2] Yan Zhu, “Crops Water Status Quantification using Thermal and Multispectral Sensing Technologies”, School of Agricultural and Biological Engineering, West Lafayette, Indiana, May 2022
[3] Rouse, J.W.; Haas, R.H.; Schell, J.A.; Deering, D.W., “Monitoring vegetation systems in the Great Plains with ERTS”, Greenbelt, NASA SP-351, 1974