The galleries found underneath Rua da Prata in downtown Lisbon are estimated to have been built in the 1st century a.C., during the peak of the Roman Empire. The Romans had occupied the western coast of the Iberian Peninsula since the 2nd century b.C., conquering Olissipo (Lisbon) during the campaigns of the First Punic War. Prior to the conquest of the Romans, the port on the Tagus estuary was already an important commercial port where Carthaginians traded with the local population, of celtic origins, trading metals and agricultural goods for manufactured products. The Romans began the fortification of the oppidum at Olissipo at the end of the 2nd century b.C. Between 40 and 30 b.C. Olissipo was granted Municipium Civium Romanorum status which conferred Roman Citizenship to all free born men. A time of peace and significant prosperity endured until the 3rd century A.D.. During the beginning of the Roman Empire, municipalities asserted themselves by erecting structures for public functions (forums, theatres, markets and temples): in Olissipo, traces of these buildings can still be found today. One example are the ruins of the Roman Theatre located on the same hill as the castle that overlooks modern day Lisbon. In those days, the majority of public life occurred by the side of the river. According to experts, the galleries underneath Rua da Prata were constructed to structurally stabilize the soil near the edges of the river which is normally very humid due the flow of groundwater to river from the surrounding hills. The underground construction of the cryptoporticus was necessary to provide a solid base for the construction of important buildings on this site. The considerable resources required to construct this subterranean cryptoporticus suggest that the buildings it supported where of significant importance such as the Lisbon forum or edifices dedicated to port and commercial activities.
The galleries consist of parallel corridors 3 m in height by 2 to 3 m wide. The corridors have vertical walls and circular ceilings.The principal corridors are intersected perpendicularly by narrower corridors. Some galleries have a maximum height between 1.2 and 1.5 m. Some galleries provide access to small, narrow chambers which could have been used as storage areas. The “cryptoporticus” designation refers to the hiding nature of this construction that was used as foundation to the ground buildings. Over the centuries, the roman structures on the surface crumbled or were replaced by new buildings. However, newer buildings were continuously constructed on the pre-existing roman foundations. The local inhabitants took advantage of the groundwater collected in the galleries by making boreholes above the galleries (see chimney on the right side of the image above). One of these wells came to be known as the “Poço das Águas Santas” located on the corner of Rua da Prata and Rua de São Julião.
The area encompassing the galleries (now downtown Lisbon) was completely destroyed in the earthquake of 1755. Marquês de Pombal (Prime Minister) and Manual da Maia (architect) were responsible for the reconstruction of the entire city, creating in downtown Lisbon the grid-like neighbourhood known today as the “Baixa Pombalina”. The roman galleries were rediscovered during the reconstruction of the downtown area of the city. Though most buildings in the “Baixa Pombalina” (downtown) are supported by pine stakes submerged in the soft and wet soil to provide structural stability, the buildings built on top of the galleries are supported by the pre-existing roman cryptoporticus which survived the earthquake unscathed. An inscribed stone was found during early archaeological investigations of the galleries dedicated to Aesculpius, the Roman god of healing. The inscription stone and the crystalline waters found on site, led to the hypothesis that the galleries may have been used as a hot water spa. Today, this hypothesis appears completely unfounded.
In the middle of the 19th century, a storm drain and sewage project was initiated to collect all the water running through the “Baixa Pombalina”. In 1859, a topographical survey of the roman galleries was completed as part of this project. Unfortunately, the storm drains intersect the galleries along the roads “Rua da Prataria (Rua da Prata”) and “Rua dos Retrozeiros (Rua da Conceição)” making the largest part of the galleries inaccessible since the location of all but two entry point from the surface have been lost.
.")


Albatroz Engineering proposed reconstructing the a 3D model of the Roman Galleries to “Museu da Cidade”. This way, not only would archaeologists possess an accurate model of the galleries but people would be able to explore the galleries, which are difficult to visit in situ, in a virtual environment.
The reconstruction involved the use of a Laser Range Scanner that measures distances to objects in the vicinity of the laser.
Data acquisition required installation of a support structure so that the laser could traverse the entire span of the galleries. Since the equipment used is designed to operate in harsh environments and is eye safe, equipment transportation, installation and data acquisition were completed while the galleries were being prepared for public access.
The accessible area of the roman galleries is comprised of six galleries of varying lengths between 12 m and 24 m and several smaller chambers.

A laser range scanner is a sweep sensor composed of three parts:
A visible or invisible light source. The emitter creates a concentrated ray of light.
Component that detects the portion of the ray of light that is reflected after it comes into contact with a target. The quantity of light reflected is dependant on the colour and nature of the target.
Mechanical system that rotates the ray of light over an arc of a circle using a sophisticated system of mirrors.
The virtual reconstruction proposed by Albatroz Engineering is based on a three dimensional model created using clouds of individual coordinates (xi, yi, zi). These types of models can be observed, rotated, navigated and manipulated in three dimensions.
Polygon surfaces can be used to unite the three dimensional coordinates thereby generating solid floors, walls and ceilings.
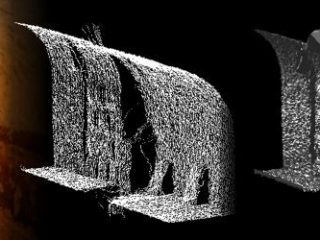
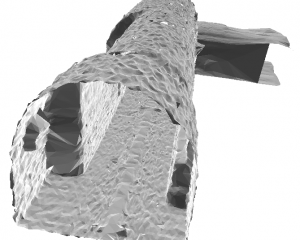
On the right there is a picture, taken in situ, of a section of the entrance gallery, the point cloud corresponding to this section of entrance gallery and finally, an image of the surfaces generated from the point cloud. Of interest is the water filled area of the floor and the two flagstones resting against the gallery wall on the right.
The number of points necessary to construct the surface model can be significantly reduced, especially in cases where the surfaces are regular and very nearly flat. Thus, the representation of the galleries can be simplified using larger surfaces which lighten the graphical computational load without sacrificing the general geometry of the model. As an example, compare the model of the entrance gallery using 155662 points with the surface model using only 8474 points (or approximately 5%).


Construction of the 3D model is based on subsequent 2D laser sweeps along each of the galleries. The animation in the following figure illustrates the process. On the left, the laser is shown as it traverses the galleries and on the right, the raw laser data.
To create the 3D model either the laser is moved within a specific environment (such as a gallery), or the scenario is moved while the laser is held in a fixed position. Since archaeological sites have dimensions several orders of magnitude greater than the laser, it is far easier to move the laser through site. One of the easiest and cost effective ways to traverse the laser sensor through the site is to use an autonomous or semi-autonomous moving platform. The key to a successful model is register and synchronize the position of the sensor over time in the reference frame of the sweeping plane.
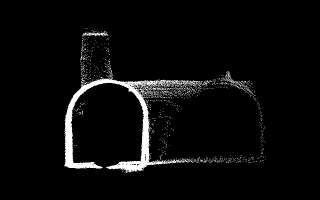
The image on the left illustrates how a laser sensor collects data as it moves along the same section of the gallery as depicted in the figure above. The laser performs a 360º sweep, represented in red, as it is traverses the gallery along its major axis. With each sweep the laser measures between 500 and 1500 points and each point is represented by the distance of the laser to the nearest obstacle in each direction. The data collected in a sample sweep shown on the right in the figure below. The laser was located approximately in centre of the gallery, circa 0.7 m above the ground. For comparison, the principal gallery (entrance gallery) is approximately 2.3 m in height while the perpendicular gallery on the left is approximately 1.4 m in height.
The laser measures the surrounding volumetric free space while the user “sees” the surfaces that the limit this free space. Analysis of the animation on the right reveals that the free space in the gallery increases as the sensor approaches a intersecting gallery or a “chimney” that is really an old water well inside a building on Rua da Conceição. Also, light fixtures are detected on the right hand side of the gallery by the abrupt change in the smooth curvature of ceiling.
One of the drawbacks of collecting data in this manner is the occlusion of all surfaces that are behind other objects present on site. This phenomenon can be observed in the shadows present in the previous figure or behind a lighting fixture in the figure on the right:
The experimental structure used for data acquisition is illustrated in the next figure below. A small push cart that carries sensors, batteries, and a computer glides along an aluminium rectangular monorail. The computer records and provides data acquisition feedback and imaging in real time.
The data is acquired, recorded and visualized in real time. The GUI permits visualization of a partial 3D reconstruction of several different galleries as shown in the figure on the right.
1 There are laser reconstruction applications where the laser remains fixed and it is the target that is moving e.g. rotating a small statue in the laser field of view.


Once the 2D sweeps of the entire site have been acquired, as illustrated in the preview figures above, the data must be assembled so that the 3D model can be generated. Assembling the data requires measurements of the change in position of the laser sensor as it traverses the site. This data is acquired using auxiliary sensors. To minimize measurement errors, the laser should be moved along rectilinear paths. If needed, as in the case of the Roman Galleries, the reconstruction required superimposing several rectilinear perpendicular paths. Other paths may be better suited to the site that is being reconstructed. The associated position errors, however, will have a tendency to increase.
The 3D model of a section of the entrance gallery is shown in the figure in the right.
Note that:
This 3D model can be represented and explored in 3D using appropriate software tools. One way to visualize the space is through VRML – Virtual Reality Modelling Language. An example is provided below.
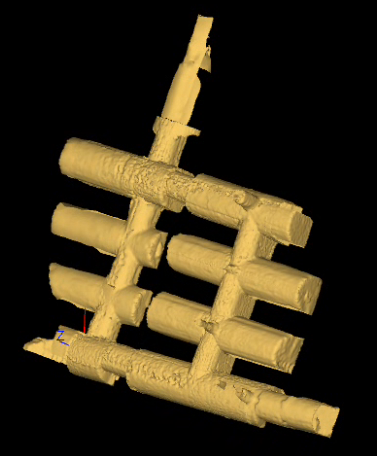
The model below was constructed from the data collected after the number of points had been reduced and surfaces generated that connect adjacent vertices.
This surface model, clearly illustrates the differences between the projected reality and the reconstructed reality. While projected models are formed by regular surfaces with rectangular edges and planar surfaces, the reconstructed model incorporates all the small irregularities of the surface of the gallery (also due, in a very small part, to measurement error), providing a more accurate model of the site.
The data shown in VRML can be imported into Computer Aided Design (CAD) software for manipulation, analysis and optimization by architects, civil engineers and archaeologists. With specialized software accurate architectural models can be created combining already existent buildings with virtual, to-be-constructed, elements or even structures that existed in the past and have long disappeared.


Images
By default, all images are propriety of Albatroz Engineering except logos that belong to the respective brands and institutions. Albatroz Engineering would like to thank those that made their pictures and images available to Albatroz Engineering. These are identified throughout the text.
VRML Models
If you are looking for a VRML client in order to visualize 3D VRML models try Cortona VRML.